An infographic (information graphic) is a representation of information in a graphic format designed to make the data easily understandable at a glance. People use infographics to quickly communicate a message, to simplify the presentation of large amounts of data, to see data patterns and relationships, and to monitor changes in variables over time.
Interested? A sampling of Parks-and-Recreation-centric infographics are below. Want to create your own? You might want to read this: 5 Tools for Creating Your Own Infographics.
 |
| https://www.healthiergeneration.org/news__events/2013/07/18/802/why_we_heart_parks_rec |
 |
| http://www.good-legal-advice.com/images/swimming-pool-accident-lawyer-causes-and-common-pool-injuries-infographic.jpg |
 |
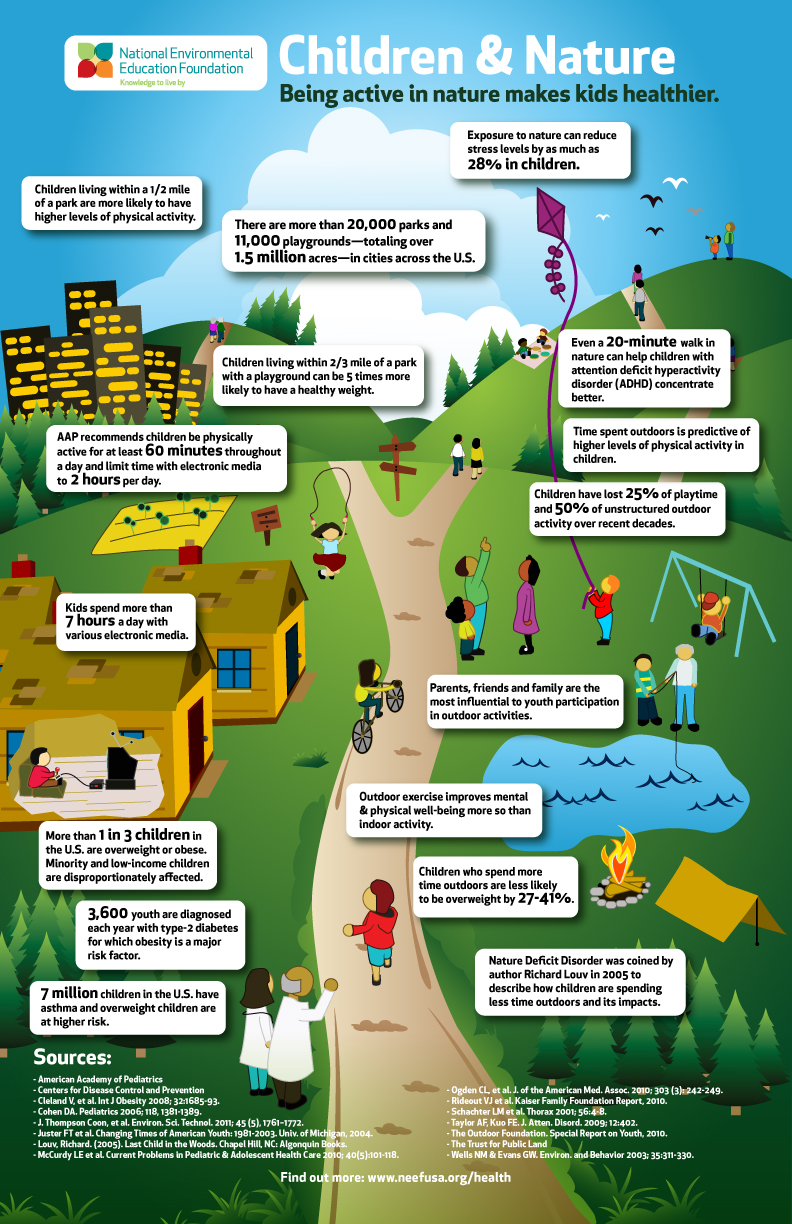
| http://ww1.prweb.com/prfiles/2013/01/24/10356018/Children%20and%20Nature%20Infographic.jpg |
 |
| http://www.physicalactivityplan.org/news.php |
 |
| http://www.mnn.com/lifestyle/responsible-living/stories/infographic-united-states-of-the-environment |
 |
| http://www.saludtoday.com/blog/tag/infographic/ |
No comments:
Post a Comment